
Research
Problem
Amazon leaders managing large teams struggle to monitor their organization's health effectively. They must coordinate with several departments to get reports on hiring, compensation, HR, and employee sentiment data. Leaders receive overwhelming amounts of data but can't identify what's important or actionable. This fragmented approach delays decision-making and increases the risk of missing critical issues that need immediate action.
Solution
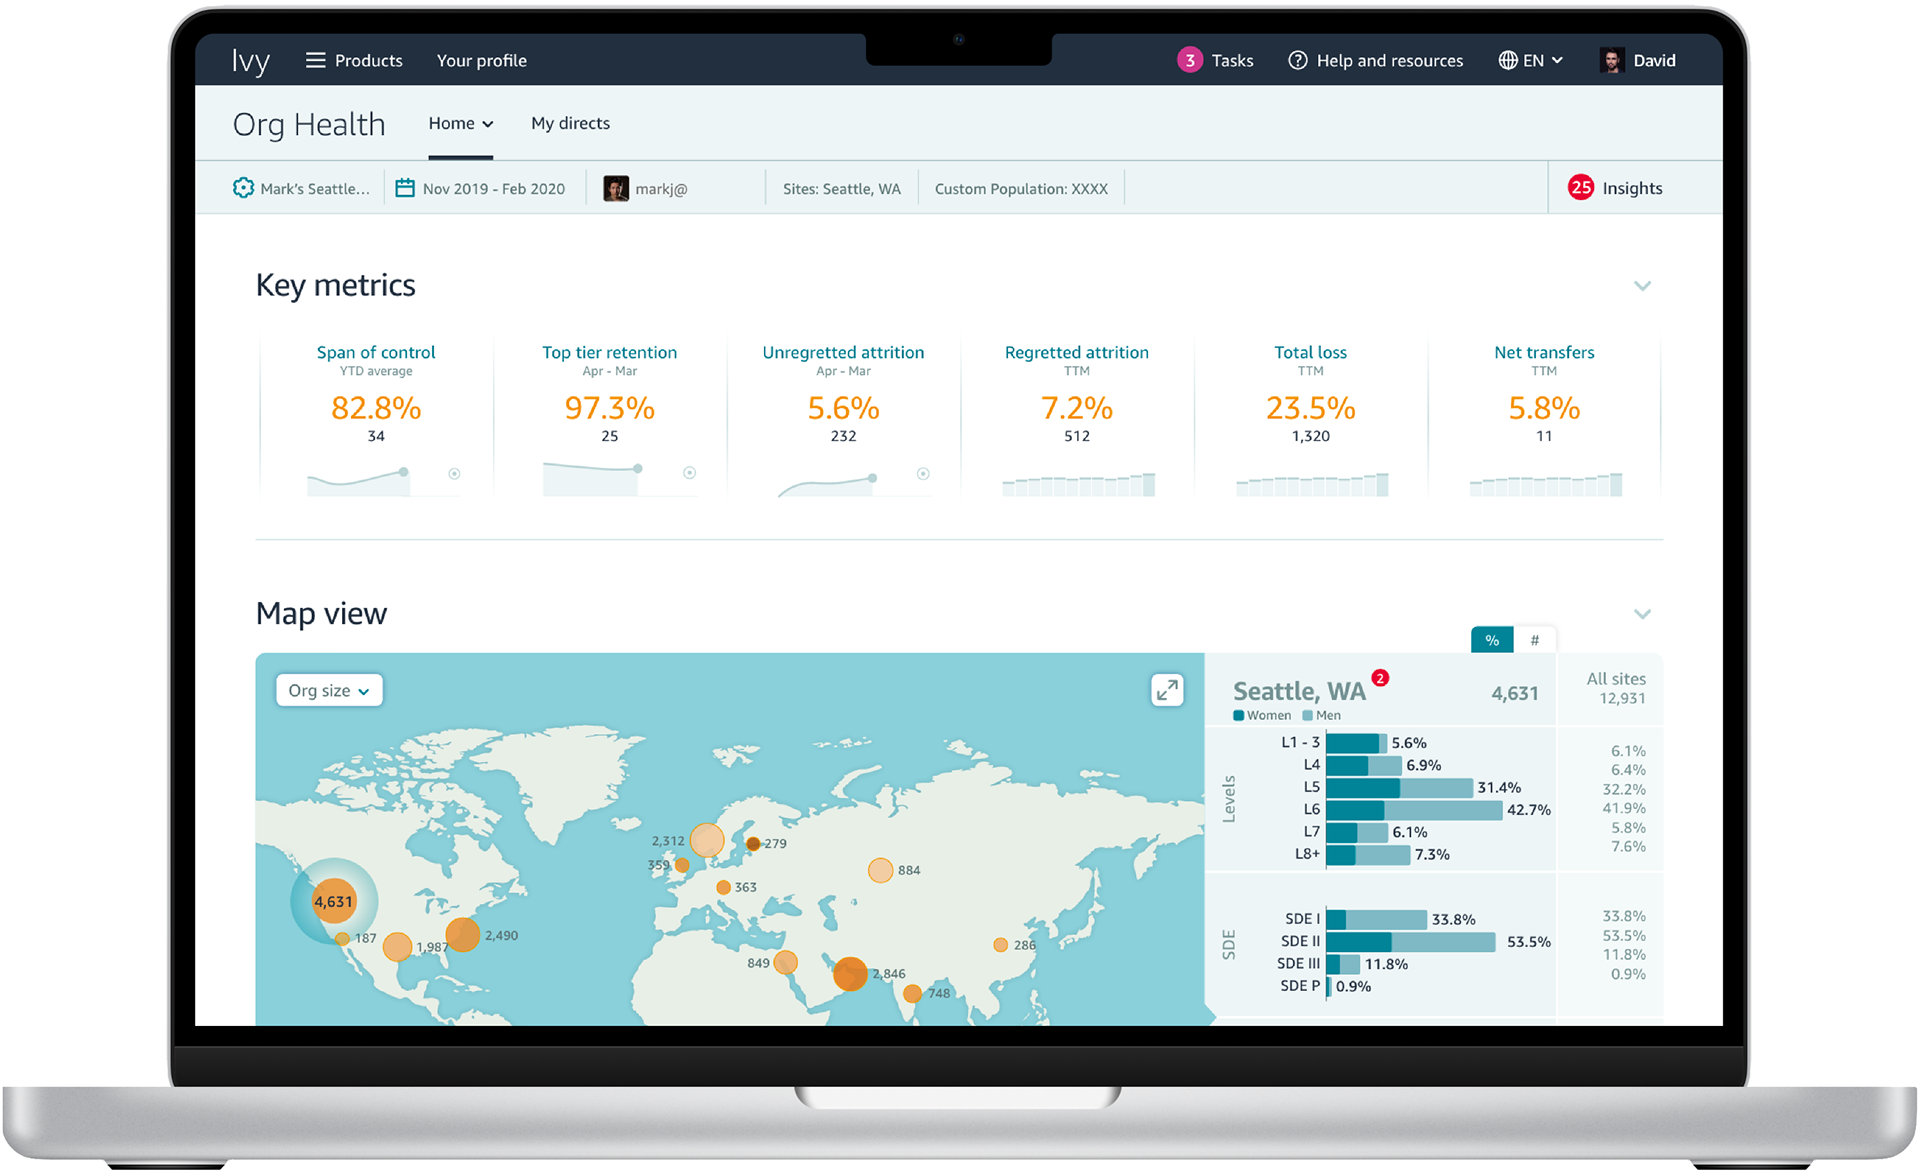
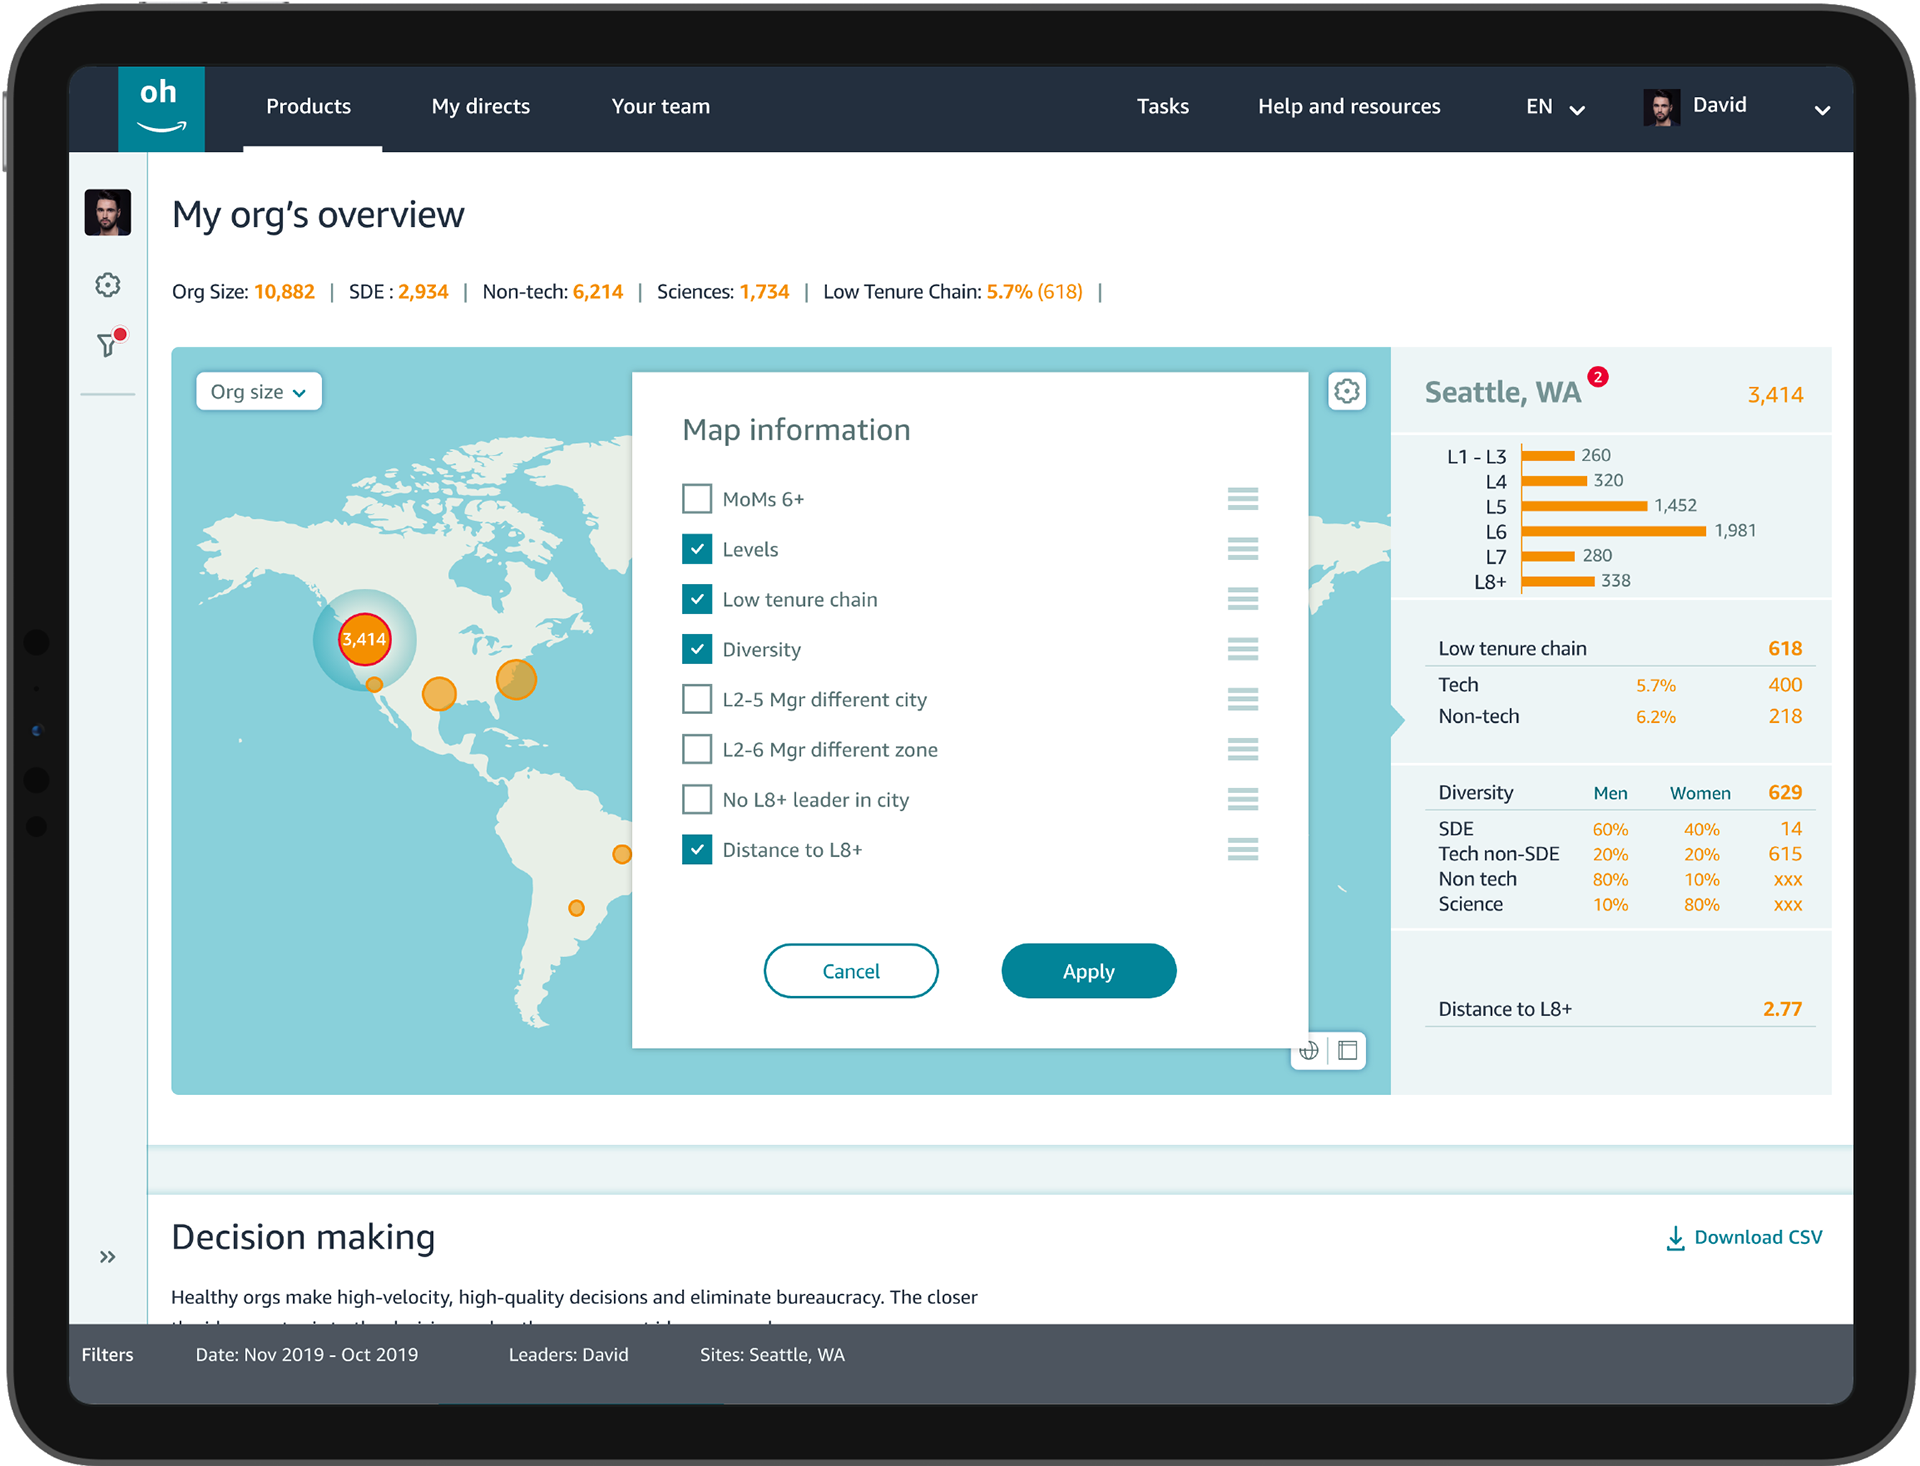
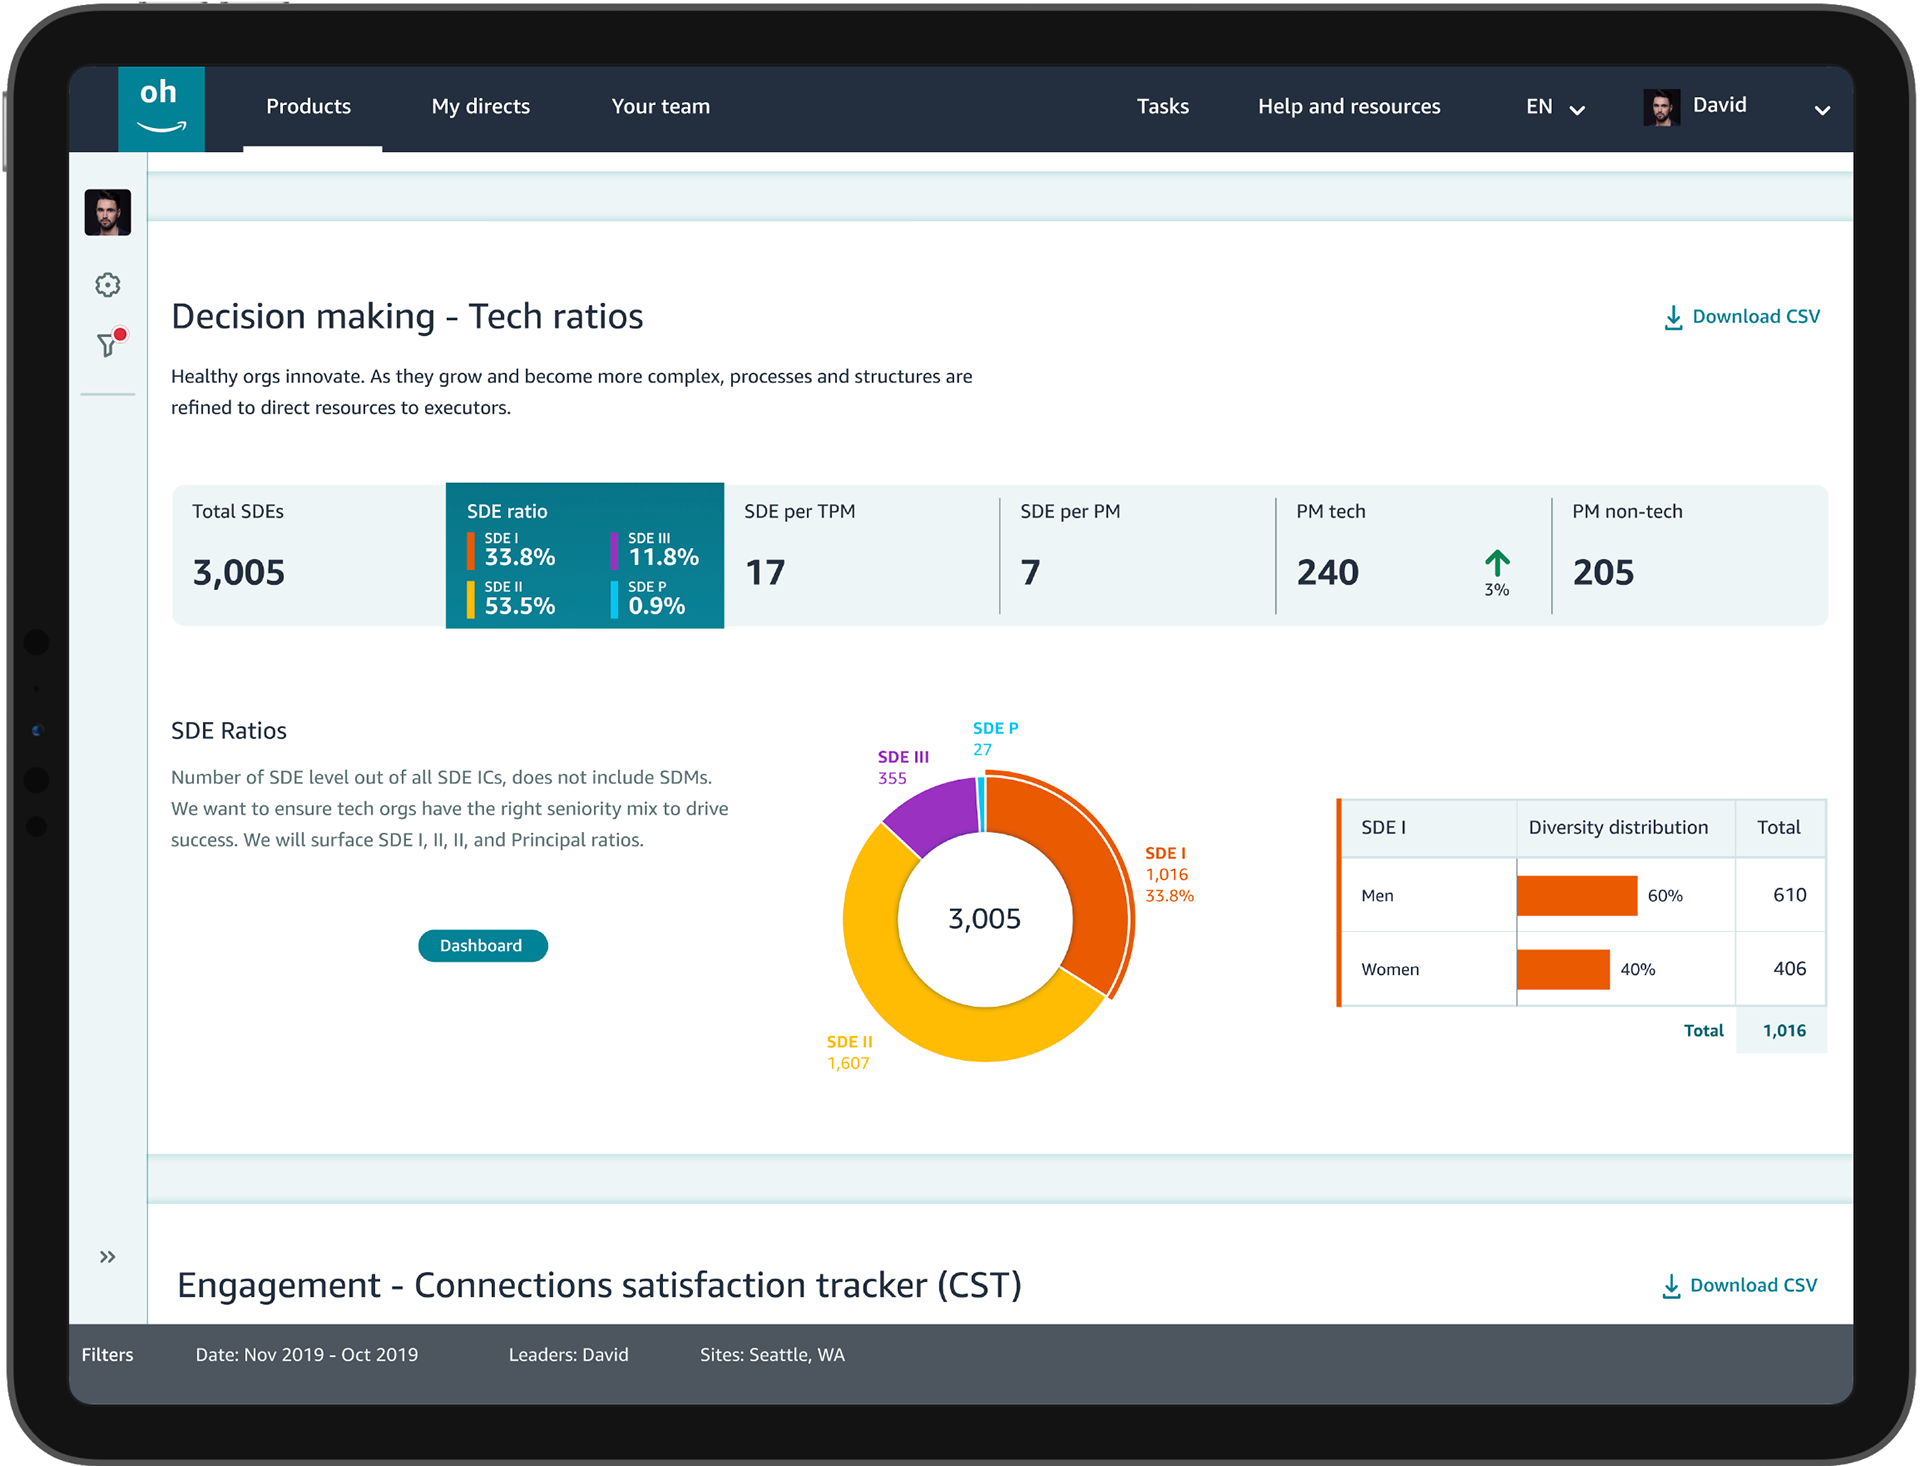
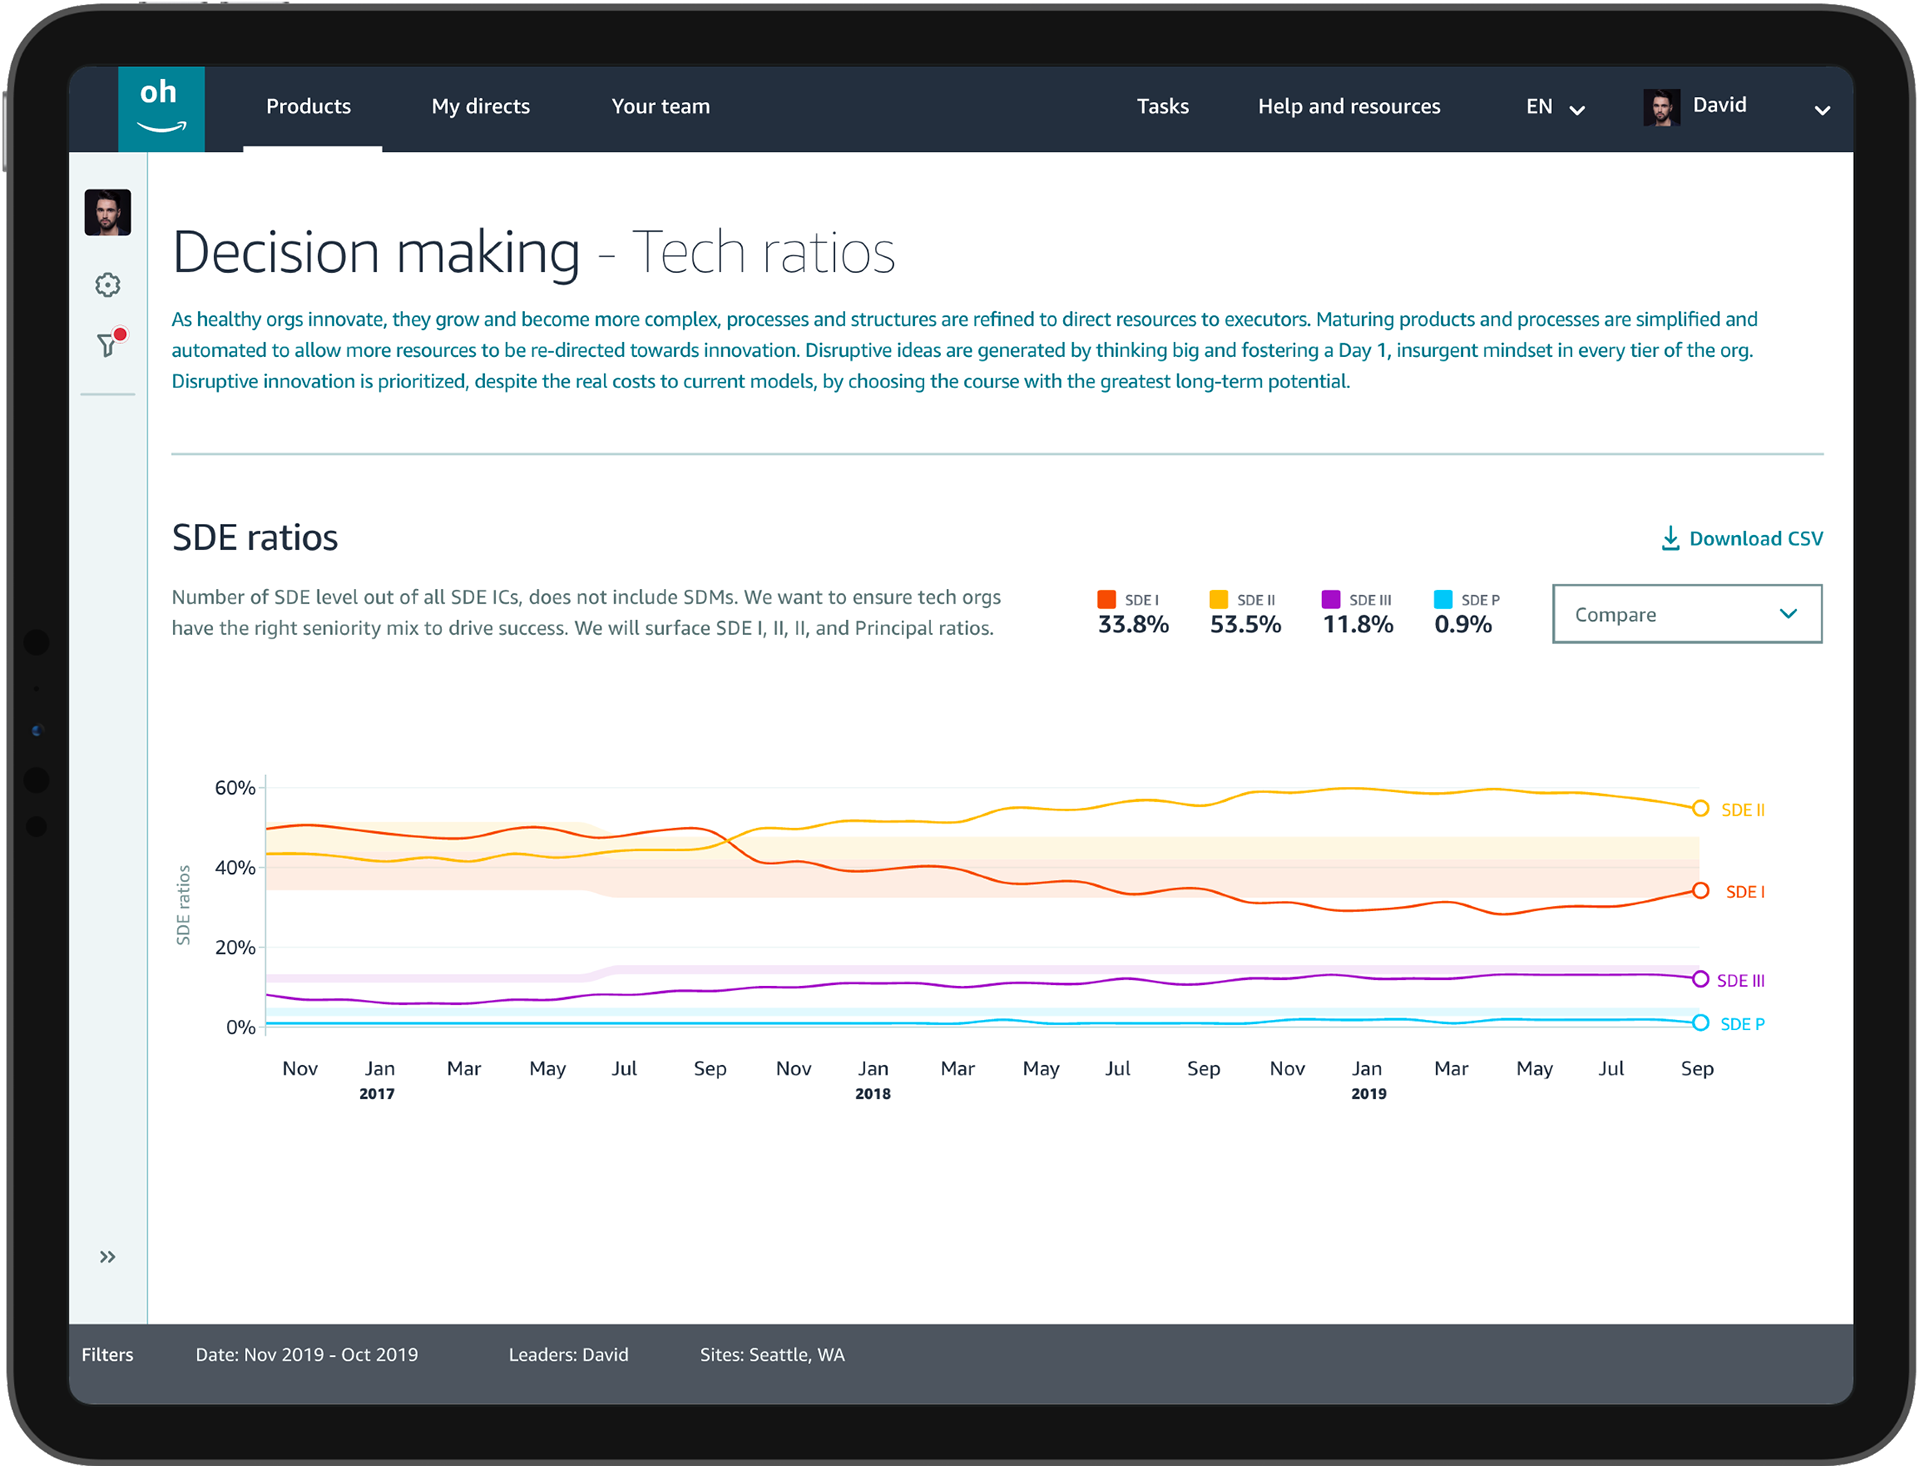
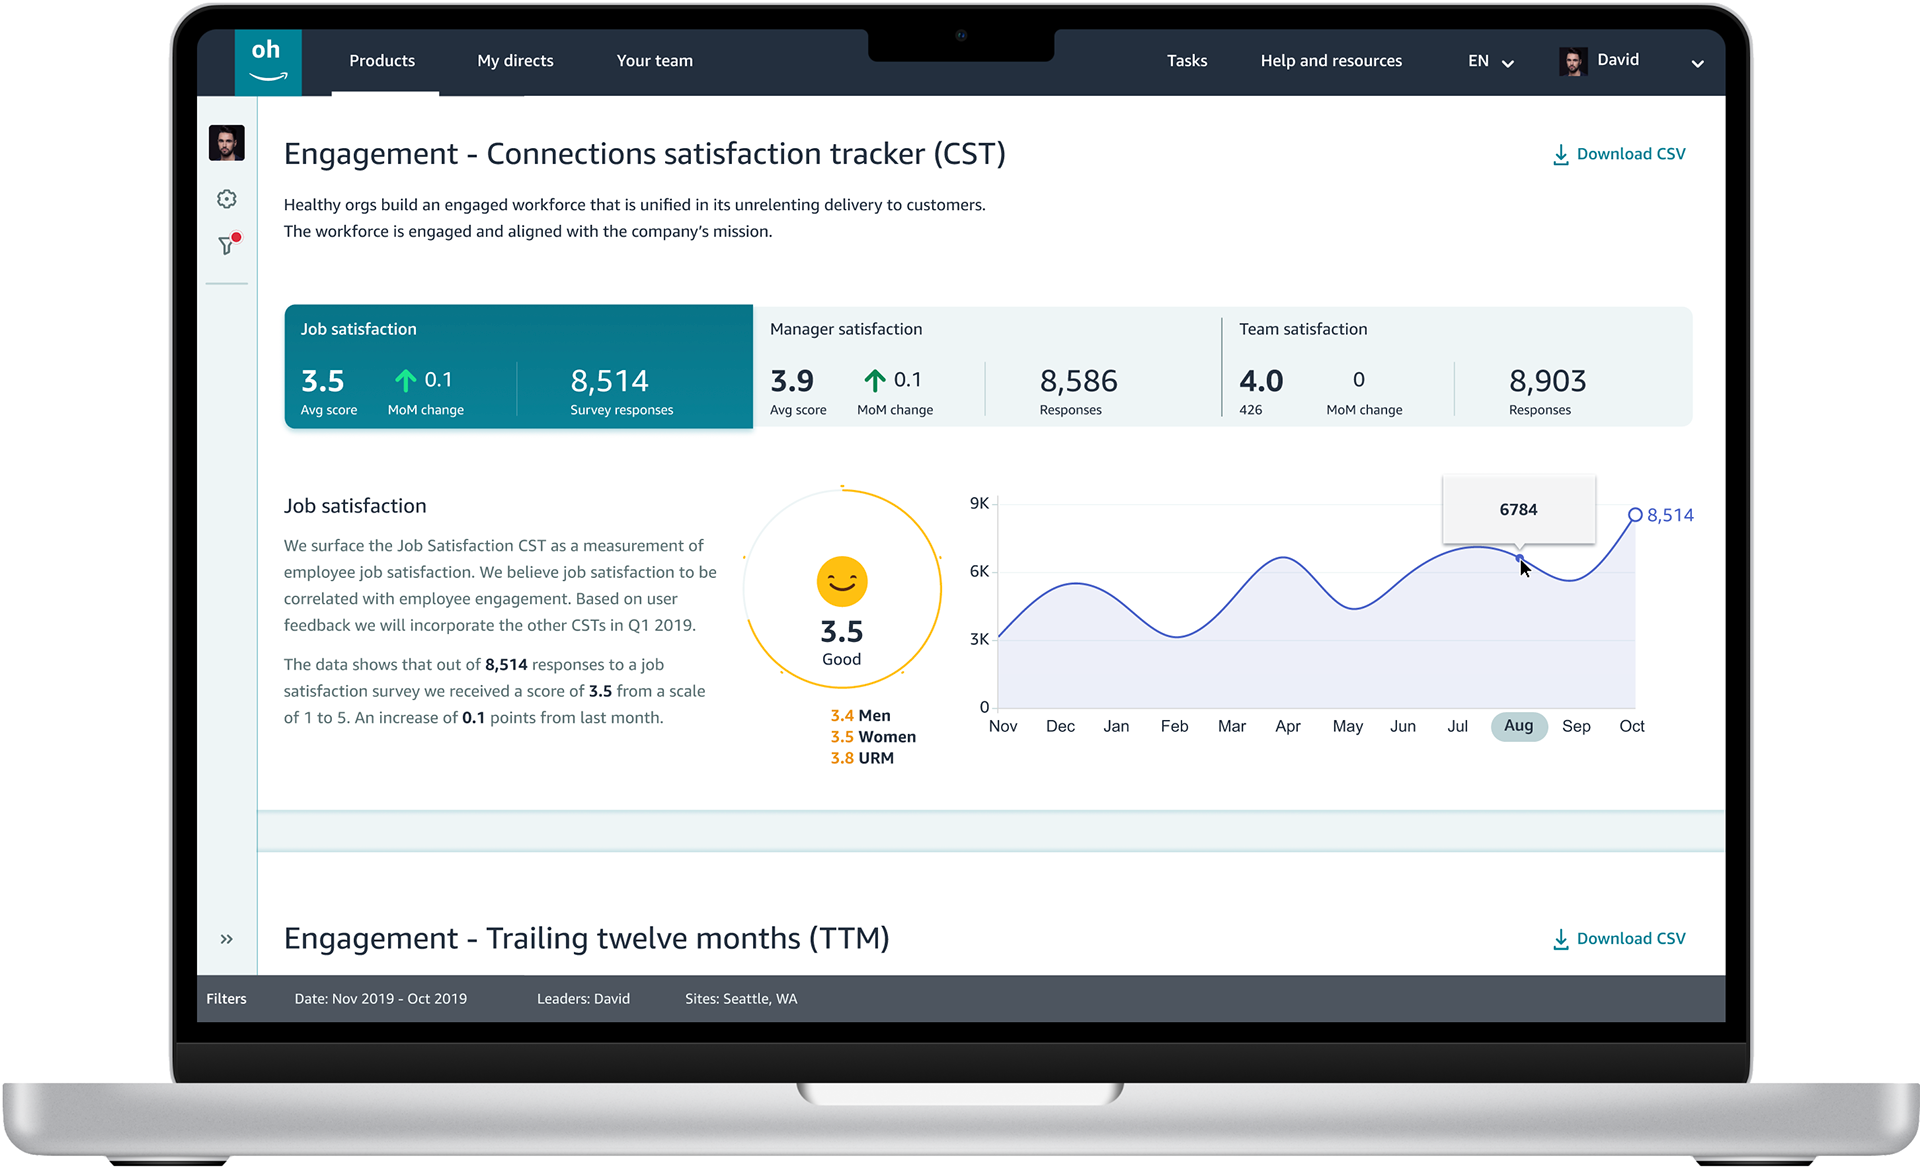
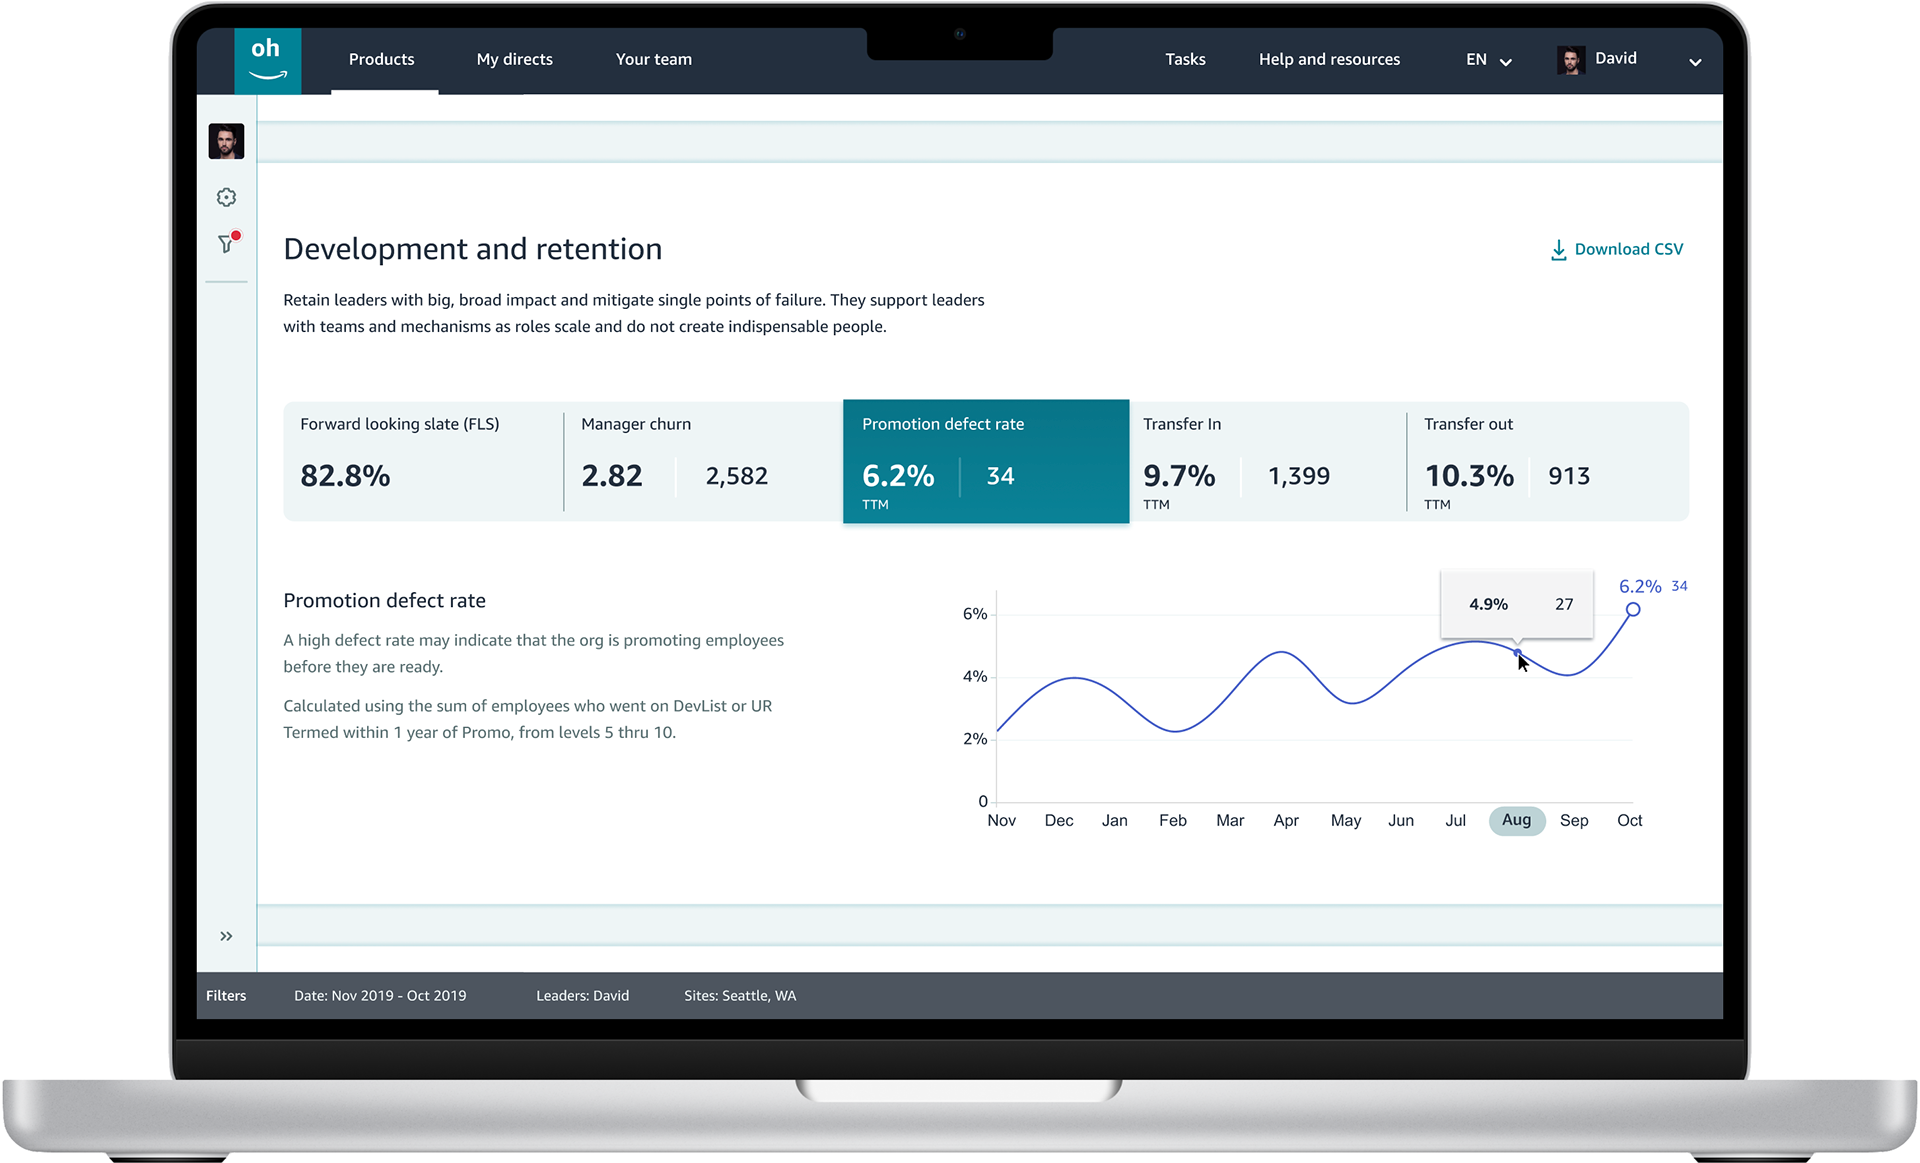
Create a new platform that consolidates HR, recruiting, compensation, and sentiment data into a single, self-service interface. The platform helps leaders focus on actionable insights while filtering out data noise. Key features include customizable views that adapt to individual needs, seamless navigation between overview and detailed analysis modes, and integrated workflows connecting insights to action tools within Amazon's Ivy framework. This eliminates the need for coordinating multiple department reports and enables leaders to quickly assess organizational health, identify priority issues, and take immediate action.
My Role
Sr. UX Engineer, Researcher, and Frontend Engineer.
My tools
Adobe XD, Qualtrics, Visual Studio, Photoshop.
Frontend tech stack
React, Stencil beta design system, D3, Mapbox, ARIA tags for accessibility, and various JS libraries.
Tech team
2x Data analysts, 1x Backend Engineer.
Research and discovery
Conducted stakeholder interviews with leaders for various orgs to understand current pain points and expectations. Performed task analysis on how leaders currently access, analyze, and act on organizational data. Surveyed leaders to identify which metrics they find most valuable and actionable versus overwhelming.
User Definition & Requirements
Created detailed personas for leaders managing different organizational sizes and types. Established success metrics for decision-making speed, data accuracy, and user satisfaction. Collaborated with data analysts teams to validate which organizational metrics have proven impact.
Design
Prototyping & Testing
Built interactive prototypes testing different data visualization approaches and navigation patterns. Conduct usability testing with target leaders using realistic organizational scenarios and data sets. Validated that users can successfully move from data insights to actionable interventions.
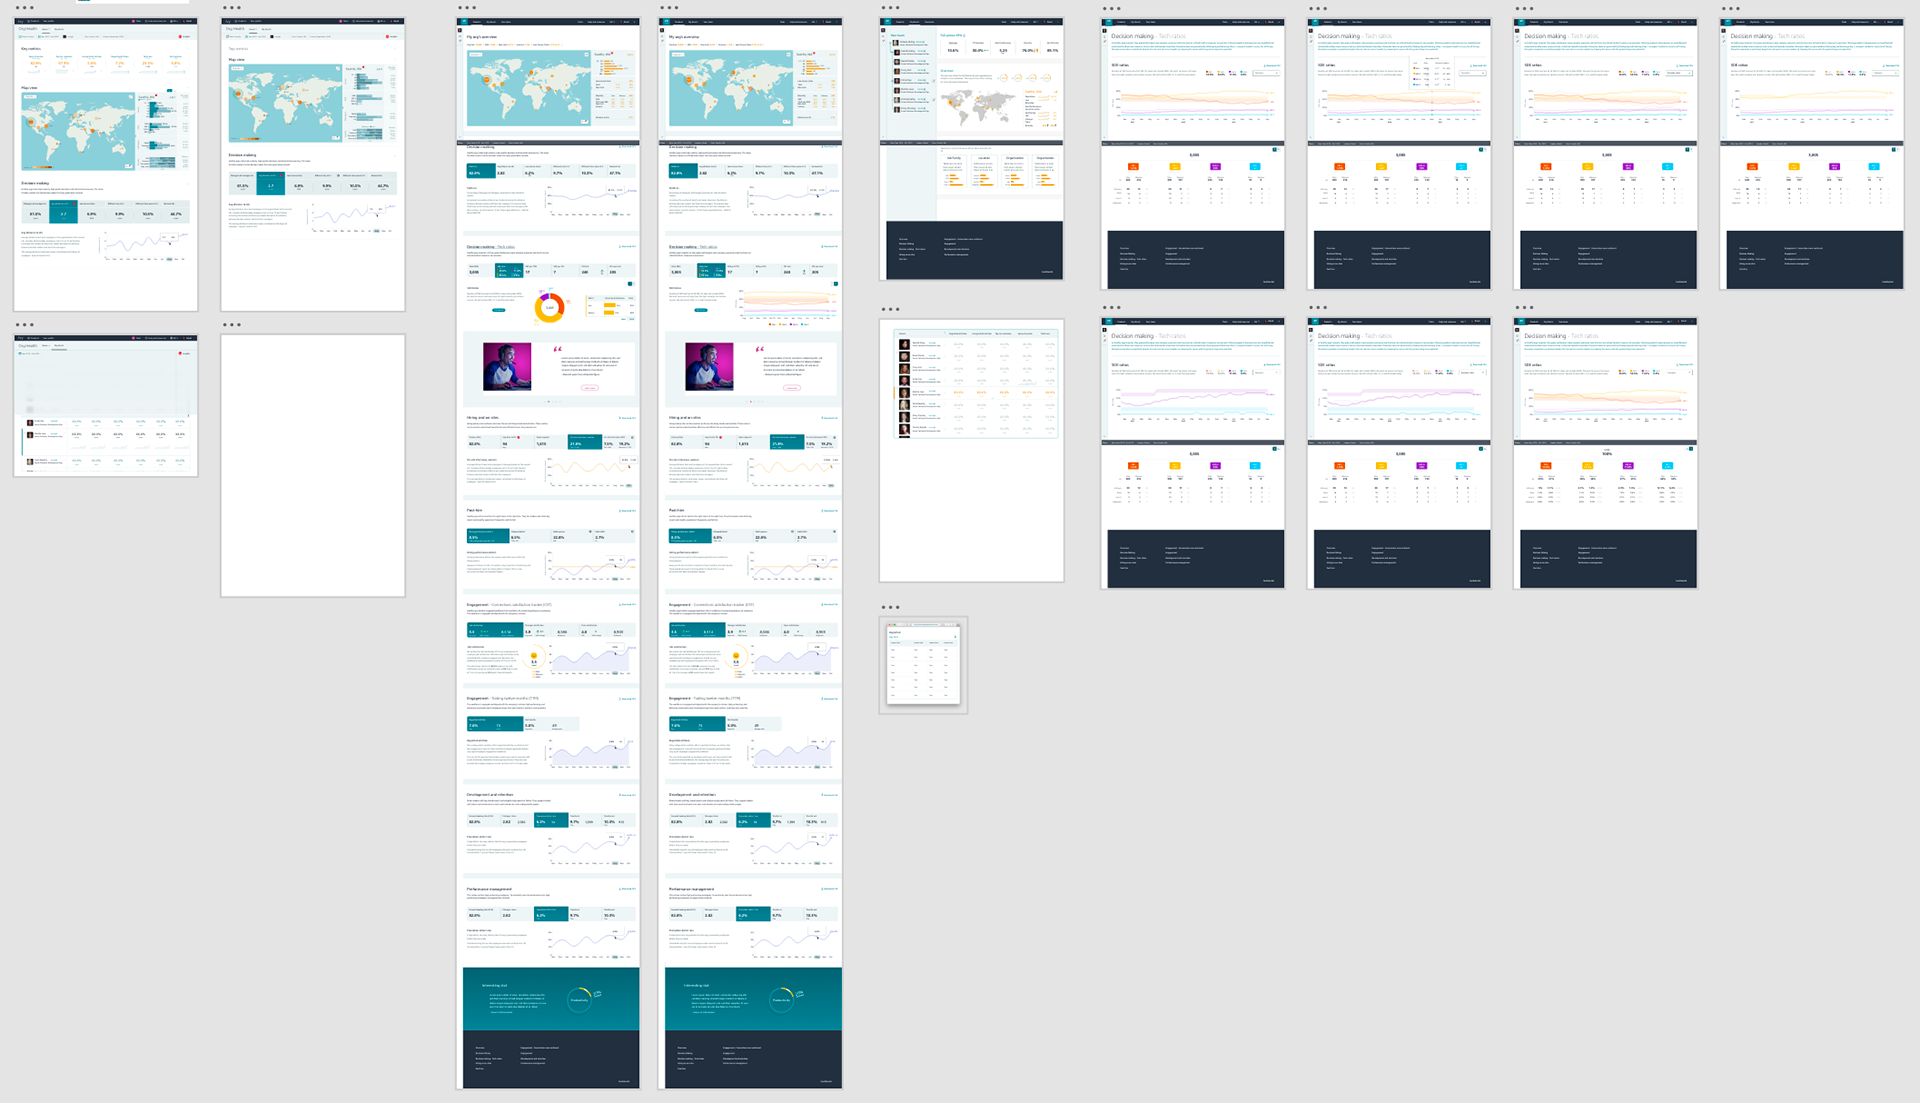
Early stages of prototype.
Development & Impact
Minimum Lovable Product (MLP)
Developed a fully functional MLP as a proof of concept using ReactJS. Developed all data visualizations using D3, maps using Mapbox. Designed the API endpoint data models. Tested and deployed it to a small team for feedback.
As the developer, I created a comprehensive MLP using ReactJS to demonstrate a the feasibility of this product and the proposed approach. I built all custom data visualizations using D3.js to represent complex metrics in intuitive formats and integrated Mapbox for geographic data visualization. Beyond frontend development, I designed API endpoints that structured disparate data sources ensuring real-time updates and historical trending capabilities. After iterative testing and troubleshooting, I deployed a functional MLP to select users for feedback collection.
Video of the MLP in action. I made a few cuts to shorten an otherwise long video.
Results & Impact
The response has been overwhelmingly positive with leaders describing it as their new main tool for reviewing their org. They can now get a Birdseye view of their org as well as dig into specific areas without having to deal with a collection of complex dashboards. The unified user interface was described as "intuitive" and "greatly useful".
Usage went up from less than 1% leaders to over 70% within the first 6 months of deployment. Net Promoter Score (NPS) hovering around 9.73. Customer Satisfaction (CSAT) hovering around 4.8/5. Retention Rate hovering around 99.36%.